Graphs and charts are essential for showing analytics, statistics, and reports in modern mobile apps. Flutter provides powerful third-party libraries that make it easy to create beautiful and interactive charts.
In this complete guide, you’ll learn:
✅ How to add chart packages in Flutter
✅ How to create Line, Bar, Pie & Area charts
✅ How to customize graph colors, labels, and animations
✅ Best practices for performance & UI
✅ Full working code examples
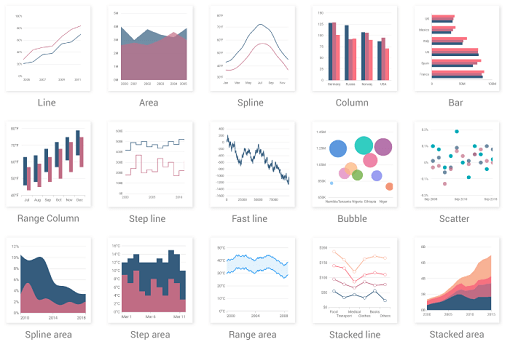
🔹 Popular Flutter Chart Libraries
Here are the most widely used chart libraries in Flutter:
| Package | Best For |
|---|---|
| fl_chart | Line, Bar, Pie, Radar charts |
| charts_flutter | Google charts style |
| syncfusion_flutter_charts | Enterprise-level charts |
| graphic | Highly customizable charts |
👉 In this tutorial, we’ll use fl_chart because it’s lightweight, fast, and open-source.
Step 1: Create a New Flutter Project
flutter create flutter_graph_app
cd flutter_graph_app
flutter run
Step 2: Add Chart Dependency
Open pubspec.yaml and add:
dependencies:
  flutter:
    sdk: flutter
  fl_chart: ^0.66.0
Then run:
flutter pub get
Step 3: Basic App Setup
Edit lib/main.dart:
import 'package:flutter/material.dart';
import 'package:fl_chart/fl_chart.dart';

void main() {
  runApp(const MyApp());
}

class MyApp extends StatelessWidget {
  const MyApp({super.key});

  @override
  Widget build(BuildContext context) {
    return MaterialApp(
      title: 'Flutter Graph Demo',
      theme: ThemeData(primarySwatch: Colors.blue),
      home: const HomePage(),
    );
  }
}

class HomePage extends StatelessWidget {
  const HomePage({super.key});

  @override
  Widget build(BuildContext context) {
    return Scaffold(
      appBar: AppBar(title: const Text('Flutter Charts Example')),
      body: Padding(
        padding: const EdgeInsets.all(16),
        child: LineChartWidget(),
      ),
    );
  }
}
📈 Line Chart in Flutter


Step 4: Create Line Chart Widget
class LineChartWidget extends StatelessWidget {
  @override
  Widget build(BuildContext context) {
    return LineChart(
      LineChartData(
        gridData: FlGridData(show: true),
        titlesData: FlTitlesData(show: true),
        borderData: FlBorderData(show: true),
        minX: 0,
        maxX: 6,
        minY: 0,
        maxY: 10,
        lineBarsData: [
          LineChartBarData(
            spots: const [
              FlSpot(0, 3),
              FlSpot(1, 5),
              FlSpot(2, 4),
              FlSpot(3, 7),
              FlSpot(4, 6),
              FlSpot(5, 8),
              FlSpot(6, 9),
            ],
            isCurved: true,
            color: Colors.blue,
            barWidth: 4,
            dotData: FlDotData(show: true),
          ),
        ],
      ),
    );
  }
}
📊 Bar Chart in Flutter


Step 5: Bar Chart Example
class BarChartWidget extends StatelessWidget {
  @override
  Widget build(BuildContext context) {
    return BarChart(
      BarChartData(
        barGroups: [
          BarChartGroupData(x: 0, barRods: [
            BarChartRodData(toY: 8, color: Colors.red)
          ]),
          BarChartGroupData(x: 1, barRods: [
            BarChartRodData(toY: 6, color: Colors.green)
          ]),
          BarChartGroupData(x: 2, barRods: [
            BarChartRodData(toY: 7, color: Colors.blue)
          ]),
        ],
      ),
    );
  }
}
🥧 Pie Chart in Flutter


Step 6: Pie Chart Example
class PieChartWidget extends StatelessWidget {
  @override
  Widget build(BuildContext context) {
    return PieChart(
      PieChartData(
        sections: [
          PieChartSectionData(
            value: 40,
            title: 'Flutter',
            color: Colors.blue,
          ),
          PieChartSectionData(
            value: 30,
            title: 'React',
            color: Colors.green,
          ),
          PieChartSectionData(
            value: 20,
            title: 'Angular',
            color: Colors.orange,
          ),
          PieChartSectionData(
            value: 10,
            title: 'Others',
            color: Colors.red,
          ),
        ],
      ),
    );
  }
}
📉 Area Chart (Filled Line Chart)
Area charts are created using LineChart with belowBarData.
LineChartBarData(
  spots: const [
    FlSpot(0, 2),
    FlSpot(1, 4),
    FlSpot(2, 3),
    FlSpot(3, 6),
  ],
  isCurved: true,
  color: Colors.purple,
  belowBarData: BarAreaData(
    show: true,
    color: Colors.purple.withOpacity(0.3),
  ),
),
🎨 Customization Options
You can customize:
- Axis titles
- Grid lines
- Animations
- Tooltips
- Touch interactions
- Gradient colors
Example:
lineTouchData: LineTouchData(enabled: true),
🚀 Best Practices
✅ Use const where possible
✅ Wrap charts in AspectRatio
✅ Avoid rebuilding charts unnecessarily
✅ Use responsive sizes for mobile
✅ Load large datasets using isolates or pagination
🔚 Conclusion
Flutter makes it easy to build professional charts using packages like fl_chart. With line, bar, pie, and area charts, you can build powerful dashboards and analytics screens for:
- Admin panels
- Finance apps
- Fitness apps
- E-commerce analytics
- Education dashboards

2 Comments
How to Publish an App on Google Play Console - Dheeraj Hitech · January 24, 2026 at 6:13 pm
[…] guide walks you through everything you need to know to publish your app on Google Play Console, from account setup to final […]
How to Sell Your Code on CodeCanyon - Dheeraj Hitech · January 28, 2026 at 2:59 pm
[…] this complete guide, you will learn how to sell your code on CodeCanyon step by step, from account creation to getting your first […]